On 7 January 2026 the answer to this question changed shape, and most advice written about added sugar has not caught up.
For five years the American rule was a share of your day: keep added sugars under 10% of calories, which on a 2,000-calorie diet is about 50 grams. One number, one day, easy to quote and nearly impossible to apply, because nobody knows what percentage of their day a muffin is.
The 2025–2030 Dietary Guidelines for Americans replaced it with something different in kind. They state that “no amount of added sugars or non-nutritive sweeteners is recommended or considered part of a healthy or nutritious diet” — and then, instead of a daily percentage, they give a unit you can actually hold: “one meal should contain no more than 10 grams of added sugars.”
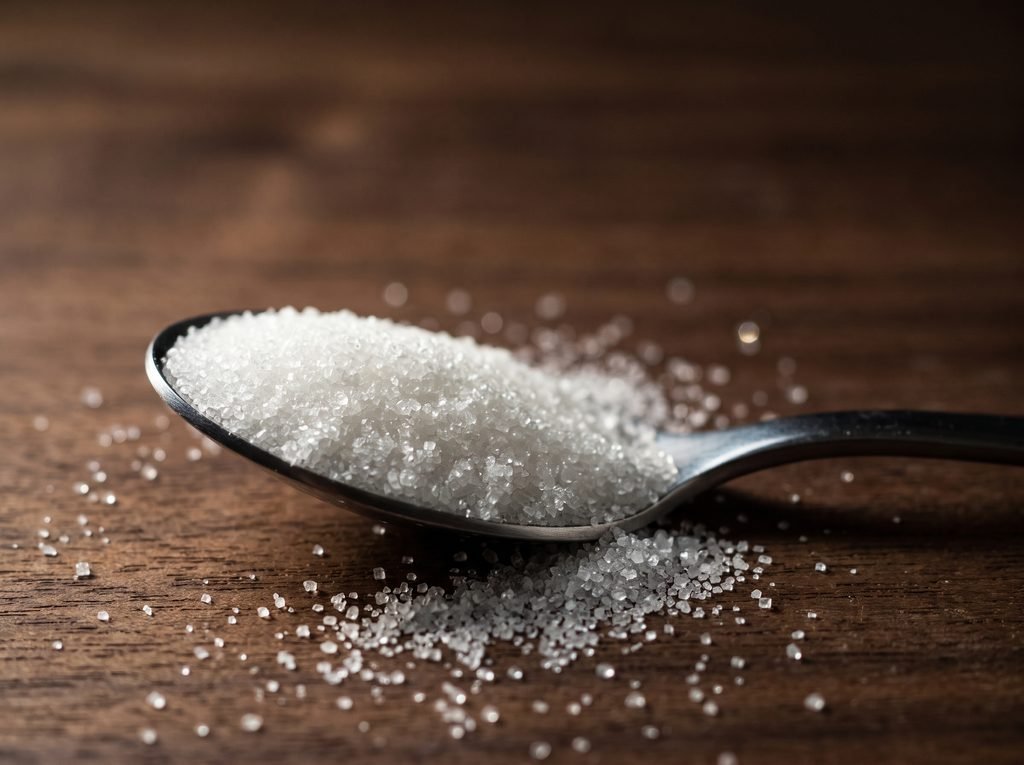
That is a smaller allowance and a far more usable one. Ten grams is two and a half teaspoons. It is also, as the rest of this page shows, less than a single flavoured yogurt, less than half a can of cola, and roughly what a jar of pasta sauce puts on two plates of spaghetti.
So this page is organised the way the new rule is: not as a daily budget, but as one day, meal by meal. Eight tables walk from breakfast to dinner and then total the day. The old percentage appears only in the timeline below, where it belongs.
How the Rule Got Here
Five dates, and the direction is one way.
| When | What was set |
|---|---|
| March 2015 | The WHO recommends free sugars below 10% of energy — a strong recommendation — and adds a conditional one for below 5%, about 25 g (6 teaspoons) a day |
| 2016 | The FDA adds an Added Sugars line to the Nutrition Facts label, with a Daily Value of 50 g, separating it from total sugars for the first time |
| 2020–2025 | The US Dietary Guidelines cap added sugars at under 10% of calories — about 50 g on a 2,000-calorie day — and tell under-2s to avoid them entirely |
| December 2024 | The FDA’s final “healthy” claim rule sets added-sugar ceilings per reference amount: ≤2.5 g for a dairy snack, ≤5 g for a grain snack |
| 7 January 2026 | The 2025–2030 Dietary Guidelines drop the daily percentage. No amount is recommended; one meal should contain no more than 10 g; avoid added sugars from birth to age 4, with none recommended from 5 to 10 |
Three things to take from the chronology.
The unit changed from the day to the meal, and that is the real news. A daily percentage is a figure you reconstruct afterwards, if ever. A per-meal gram limit is a figure you can check against a label while standing up. Whatever you think of the number, it is the first added-sugar guidance that can be used at the point of decision.
The 10%-of-calories cap is no longer the American rule. It was, until January 2026. In the current edition the only 10%-of-calories limit is on saturated fat, not sugar — a distinction easy to get wrong, and one that a great deal of published advice now gets wrong. The WHO’s 10% recommendation still stands; the American one has been superseded.
The age guidance moved a long way. “Avoid under 2” became avoid through early childhood and none recommended to age ten. That is a substantial tightening, and it is the part of the new edition with the least public attention.
Added, Free, Naturally Occurring
Three terms are in circulation and they do not mean the same thing. The table sorts them, because the whole day below depends on knowing which sugars you are counting.
| The sugar | Counts as added (US label and guidelines) | Counts as free (WHO) | Example |
|---|---|---|---|
| Sugar, syrup or honey put in during cooking or manufacturing | Yes | Yes | The sugar in a biscuit |
| Honey, maple syrup, agave — eaten on their own or added | Yes | Yes | A spoonful of honey in tea |
| Concentrated fruit or vegetable juice used as a sweetener | Yes | Yes | “Sweetened with fruit juice” |
| Sugar naturally in 100% fruit juice | No | Yes | A glass of orange juice |
| Sugar naturally in whole fruit | No | No | An apple |
| Sugar (lactose) naturally in plain milk | No | No | A glass of milk |
The fourth row is where the two systems part company, and it matters more than it looks.
Fruit juice is the disagreement. By the American label it carries no added sugar; by the WHO’s definition it is a free sugar, because once the fibre and structure are gone the sugar behaves like any other. The large cardiovascular study discussed later in this page used the free sugars definition, and fruit juice was among its three named sources. So a page that counts only what the label calls “added” will undercount by a glass of juice.
Honey, maple syrup and coconut sugar are added sugars. This is the most common misreading of the label. They carry trace minerals and a different flavour; they count in full. The 2025–2030 Guidelines list honey and molasses explicitly among the names added sugars travel under, alongside anything containing “sugar” or “syrup” or ending in -ose.
And whole fruit is outside all of this. No guideline on earth limits the sugar in an apple. The fibre and the chewing slow the delivery, and no body has reported evidence of harm from intact fruit. Where you will see the two systems agree completely is here — which is why “fruit has sugar too” is not an argument against any of the limits below.
One practical consequence: all of this is settled for you on the panel, where the Added Sugars line sits directly beneath Total Sugars and takes about four seconds to read — the highest-yield habit in reading a nutrition label.
Breakfast
The cap is 10 grams for this meal. Breakfast is where it is hardest to stay under, because almost everything marketed for the morning is sweetened.
| A typical breakfast | Added sugar | Against the 10 g meal cap |
|---|---|---|
| Plain oats, milk, a sliced banana | 0 g | Nothing spent |
| Two slices of ordinary sandwich bread, butter | about 2–5 g | A quarter to half the meal |
| A single pot of flavoured yogurt | about 15–20 g | Over, on its own |
| A sweetened breakfast cereal, one bowl | about 9–15 g | At or over |
| A shop-bought granola bar | about 8–12 g | At or over |
| A blueberry muffin | about 25–30 g | Two and a half meals’ worth |
| A pastry and a flavoured latte | about 35–55 g | Three to five meals’ worth |
These are typical category ranges, not measurements of a particular product — which is the point: the variation inside a row exceeds the gap between rows. Two flavoured yogurts on the same shelf can differ by 12 grams. The label settles it; nothing else does.
Two observations about the morning specifically.
The plain-plus-fruit swap is the only move that reliably works. Plain yogurt with fruit you add yourself runs at zero added sugar and tastes sweet. Flavoured yogurt gets you 15 to 20 grams for the same sensation. This is the single highest-value substitution on this page, and it is one aisle decision.
And the per-meal cap exposes something the daily percentage hid. Under the old rule, 20 grams at breakfast was 40% of a day’s allowance — uncomfortable but survivable. Under the new one it is twice the limit for that meal, before nine in the morning, with lunch and dinner still to come. Same breakfast, much clearer verdict.

The Drink That Comes With It
Beverages get their own section because they are not a category like any other. Sugar-sweetened drinks account for about 24% of all added sugar intake — close to a quarter of the problem in one aisle — and the 2025–2030 Guidelines name them for outright avoidance: “avoid sugar-sweetened beverages, such as sodas, fruit drinks, and energy drinks.”
| What you drink | Added sugar | Against the 10 g meal cap |
|---|---|---|
| Water, black coffee, plain tea | 0 g | Nothing spent |
| Plain milk | 0 g added (lactose is not added sugar) | Nothing spent |
| A 12 oz can of regular cola | about 39–42 g, roughly 10 teaspoons | Four meals’ worth |
| A large flavoured coffee drink | about 25–50 g | Two and a half to five meals’ worth |
| An energy drink | about 25–40 g | Two and a half to four |
| A glass of 100% fruit juice | 0 g added — but a free sugar by the WHO’s count | The one row the two systems score differently |
The cola row is worth sitting with. The American Heart Association puts a can at about ten teaspoons of added sugar, which is more than a man’s entire daily limit of 36 grams and well over a woman’s 25. Against the new per-meal cap it is four meals’ allowance, in a container that takes four minutes to empty and leaves you no fuller than before.
Liquid sugar is the one place where the evidence is strongest, not just the quantity. As the evidence section below sets out, the clearest harm signals attach to sugar in drinks rather than sugar in solid food. That is not a reason to ignore the rest; it is a reason to start here.
And this is the cheapest single change available. No cooking to change and no label to read: switching the daily can or flavoured latte to water, coffee or plain tea removes more added sugar than every other substitution here combined. A sweetened drink does hydrate you, like any beverage — as the research on water intake makes clear — which is why the swap costs nothing. Water does the same job without the four meals’ worth.
Lunch, Where the Sugar Is Savoury
Nobody expects sugar in lunch, which is why lunch is where the per-meal cap gets spent without anyone tasting it. The items below are not sweet. They are sweetened.
| A savoury lunch component | Added sugar | Against the 10 g meal cap |
|---|---|---|
| Two slices of ordinary sandwich bread | about 2–5 g | A quarter to half |
| A tablespoon of ketchup | about 4 g | Nearly half, from one squeeze |
| Two tablespoons of a sweet salad dressing | about 3–7 g | A third to two-thirds |
| Barbecue sauce, two tablespoons | about 10–16 g | At or over, on its own |
| Teriyaki or sweet chilli sauce, two tablespoons | about 8–14 g | At or over |
| A “healthy” bottled smoothie | 0 g added (if 100% fruit) — but free sugars, often 30 g+ | Scores differently under each system |
Add the realistic combination — a sandwich on ordinary bread, ketchup on the side, dressing on the salad — and a lunch that nobody would call sweet arrives at 9 to 16 grams. The cap is ten. That is the finding of this section, and it is the one most people have never had put in front of them.
Two things make savoury sugar different from the obvious kind.
You get no sensory warning, so there is no satiety feedback either. A muffin announces itself and you decide whether you want it. Ketchup does not, and nobody has ever eaten less of their lunch because the bread was sweetened. The sugar arrives without entering the decision.
The fix is a one-off purchase, not a daily discipline. Unlike the muffin, these are substitution problems: a bread without added sugar, a vinaigrette of oil and vinegar, a tomato sauce whose label shows 0 g. You decide once in the shop and the change holds for every lunch afterwards. This is the highest-leverage, lowest-effort category on the page — the opposite of the morning pastry, which costs willpower every single day.
The Afternoon, Marketed as Health
The afternoon has its own category: foods whose entire positioning is wellness. The FDA’s December 2024 “healthy” rule gives us, for the first time, a regulated number to judge them against.
| The afternoon item | Added sugar | The FDA “healthy” ceiling it must meet |
|---|---|---|
| A plain yogurt, any size | 0 g | Dairy snack: ≤2.5 g per ⅔ cup equivalent — passes easily |
| A flavoured yogurt | about 15–20 g | Fails the dairy ceiling several times over |
| A wholegrain cracker, plain | about 0–1 g | Grain snack: ≤5 g per ¾ oz whole-grain equivalent — passes |
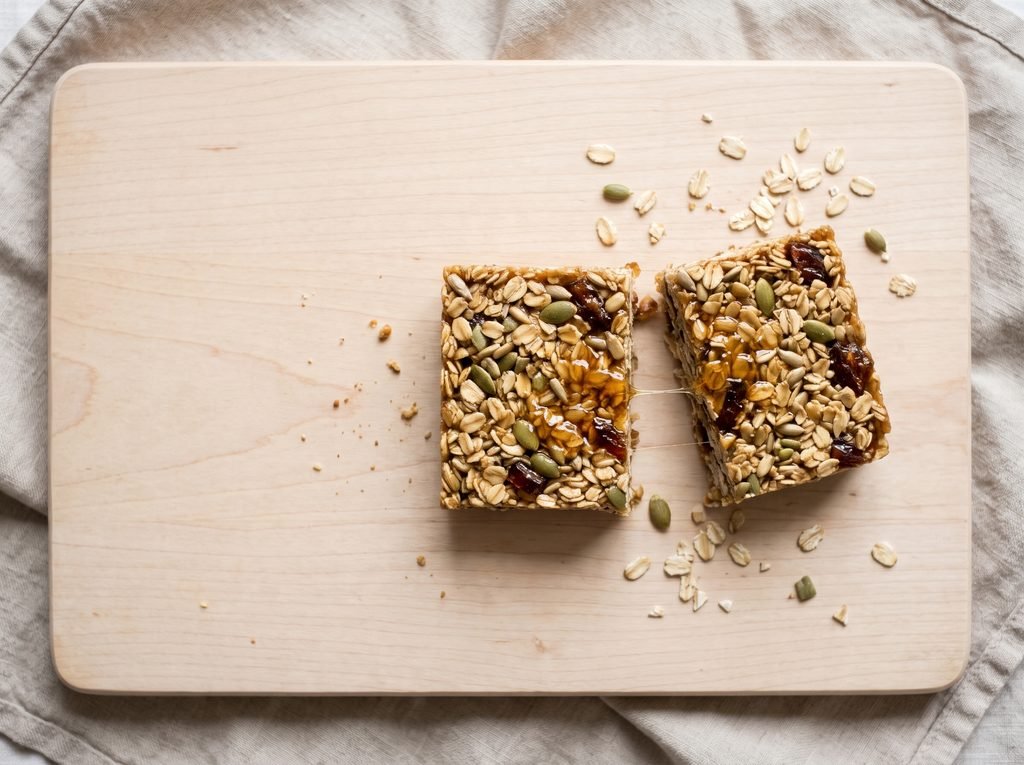
| A “protein” or granola bar | about 8–12 g | Fails the grain ceiling |
| A chocolate-chip cookie | about 8–12 g | Makes no health claim, and lands in the same range |
| A handful of nuts, unsweetened | 0 g | Qualifies as “healthy” under the new rule |
The fifth row is the uncomfortable one. A granola bar and a cookie frequently carry the same added sugar. One is shelved as a health food and one is shelved as a treat, and the difference is in the packaging rather than the panel. Nothing here says you should not eat a cookie; it says you should not believe the bar is a different kind of thing.
The regulated ceilings are strikingly low, and that is useful. Two and a half grams for a dairy snack is about half a teaspoon. Five grams for a grain snack is a little over one. Any product that cannot say “healthy” on the front after February 2028 will have failed one of those, and they are now the sharpest objective line available for judging a snack — much sharper than any claim.
The 2025–2030 Guidelines adopted those exact ceilings, deliberately aligning the label rule with the dietary advice — so a single number now does work that a paragraph of advice used to do badly. And sugar is only one reason these products are easy to overeat: energy density and eating speed do work of their own, as the research on ultra-processed food shows.
Dinner
Dinner is the meal most likely to come in under the cap, and the one where a single jar can undo it.
| The dinner element | Added sugar | Against the 10 g meal cap |
|---|---|---|
| Meat, fish, vegetables, rice, cooked plainly | 0 g | Nothing spent |
| Jarred pasta sauce, ½ cup | about 6–10 g | Over half to the whole cap |
| A sweet stir-fry or simmer sauce, per portion | about 8–14 g | At or over |
| A glaze or marinade on meat, per portion | about 6–12 g | Over half to over |
| Shop-bought dessert, one portion | about 20–30 g | Two to three meals’ worth |
| Tinned tomatoes, herbs, garlic, olive oil | 0 g | The same dish, nothing spent |
The first and last rows are the argument. A plate of pasta with tinned tomatoes, garlic and olive oil carries no added sugar; the same plate with a jarred sauce carries most or all of a meal’s allowance — and the difference in effort is a few minutes.
One closing note on the evening.
The 2025–2030 Guidelines ask for no added sugar in specific places you would not think to check. Full-fat dairy should have none. Frozen, dried and tinned fruit and vegetables should have none or very little. Meat should have none or limited. These are not sweet foods; they are foods where sweetening is a processing habit, and the new edition names each one.
The Day, Totalled
The day is done. Here is what the various rules make of it.
| The figure | Grams of added sugar | In teaspoons |
|---|---|---|
| Three meals at the new per-meal cap | 30 g | about 7½ |
| AHA limit, women | 25 g | 6 |
| AHA limit, men | 36 g | 9 |
| WHO conditional recommendation (below 5% of energy) | about 25 g | 6 |
| The FDA label’s Daily Value | 50 g | 12 |
| What US adults actually average | about 71 g | 17 |
| US men / US women, measured | about 80 g / 63 g | 19 / 15 |
Four things fall out of this table, and the first is the most reassuring.
The rules converge much more than the headlines suggest. Three meals at ten grams is 30 g. The AHA says 25 for women and 36 for men. The WHO’s stricter recommendation is about 25. That is a cluster between 25 and 36 grams — six to nine teaspoons — from three independent bodies using three different methods. There is no serious disagreement about the target.
The label’s 50 grams is the outlier, and it is not advice. The Daily Value exists to make percentages computable on a panel, and it sits well above every health body’s recommendation. A product at 20% DV is giving you 10 g — a whole meal’s cap — while the panel reads as a modest fifth of a day. Read the grams, not the percentage, for this one nutrient.
The gap between target and reality is a factor of about two and a half — seventeen teaspoons against six to nine. That is the real size of the problem: not a tweak, and not a hopeless chasm. And it is worth correcting a figure in wide circulation: you will often see “the average American eats 22 or 23 teaspoons a day.” The measured national figure is 17 teaspoons for adults — men 19, women 15. The higher number is an older estimate, and quoting it overstates the problem by about a third, which does no favours to anyone trying to be believed.
And the per-meal cap is stricter than it looks, because it does not cover drinks and snacks. Three meals at 10 g is 30 g only if nothing is eaten between them. Add one can of cola and the day is at 70 — the national average — from a single purchase.
What the Evidence Actually Shows
The numbers above are recommendations. This section is about what sits underneath them, including the part that is weaker than you may have been told.
Teeth are the strongest and least discussed finding. The WHO’s recommendations rest substantially on dental caries, where the dose-response relationship is about as clear as nutrition gets — the stricter 5% figure came largely from populations whose sugar supply collapsed and whose tooth decay fell with it. Unglamorous, and the best-established harm on the list.
Cardiovascular disease: a large cohort, with a modest effect size. The study here is Kelly et al., BMC Medicine, 2023 — 110,497 UK Biobank participants, mean follow-up 9.4 years, 4,188 cardiovascular events. For every 5% of energy from free sugars, cardiovascular disease risk was 7% higher, heart disease 6% higher and stroke 10% higher. Fibre at 5 g a day was associated with 4% lower risk, though that association did not survive adjustment for BMI. The named sources driving it were sugary drinks, fruit juice and sweets — and the authors concluded their findings support the WHO’s below-5% recommendation, which until then had rested mainly on teeth. It is an observational study, so it shows association rather than cause; it is also one of the largest of its kind.
Liver fat: a small randomised trial, and the cleanest causal evidence available. Schwimmer et al., JAMA, 2019 randomised 40 adolescent boys with non-alcoholic fatty liver disease to a diet of under 3% of calories from free sugars or their usual diet for eight weeks, with meals provided and artificial sweeteners prohibited. Hepatic steatosis fell from 25% to 17% in the intervention group against 21% to 20% in the controls — an adjusted mean difference of 6.23% (95% CI 3.02 to 9.45) — and ALT was significantly lower at eight weeks (P < 0.001). Forty boys is a small trial and they already had liver disease, so it does not generalise to healthy adults. But it is a randomised feeding trial with an imaging endpoint, and it is the strongest causal link on this page.
Diabetes risk: the signal is in drinks. Pooled cohort analyses have put the rise in type 2 diabetes risk at roughly a quarter per daily serving of a sugar-sweetened drink, and the consistent pattern is that liquid sugar carries clearer risk than the same sugar in solid food — the evidential reason the drinks section comes first. Managing an existing diagnosis is a separate question, handled in the guide to eating with type 2 diabetes.
The critique, and who paid for it
One review is cited constantly by people arguing the sugar limits are unfounded, usually without being named. It deserves naming, reporting accurately, and disclosing.
It is Erickson, Sadeghirad, Lytvyn, Slavin and Johnston, Annals of Internal Medicine, 2017 — a systematic review of 9 guidelines containing 12 recommendations. Its conclusion was that sugar guidelines “do not meet criteria for trustworthy recommendations” and that the evidence was of low to very low quality by GRADE. On the narrow methodological point it is largely right, and this page does not dispute it: the recommendations rest on observational data and caries evidence rather than long-term randomised trials of hard outcomes, because such trials have never been run and probably never will be.
And its primary funder was the Technical Committee on Dietary Carbohydrates of the International Life Sciences Institute, North America — a body primarily supported by the food and agriculture industry. The authors state they conducted the work independently of the funder. An editorial in the same issue, titled “Guidelines to Limit Added Sugar Intake: Junk Science or Junk Food?”, disputed the review’s methods and conclusions, and one of its authors said publicly that the review’s writers were “hijacking the scientific process in a disingenuous way to sow doubt and jeopardize public health.”
You can hold both facts at once, and you should. The evidence genuinely is weaker than the confidence of the advice suggests. The review that said so loudest was paid for by the industry with the most to gain from it being said. Neither observation cancels the other, and a page that reports only one of them is not informing you.
What survives all of it: teeth, where the evidence is strong; drinks, where it is clearest; and the fact that nothing is lost by eating less added sugar, which is the asymmetry that makes the advice reasonable even on weak evidence.
Frequently Asked Questions
How much added sugar per day is too much? Three independent bodies land in the same place: 25 g for women and 36 g for men (American Heart Association), about 25 g (WHO’s stricter conditional recommendation), and 30 g if you take the new American per-meal cap of 10 g across three meals. Call it six to nine teaspoons. US adults average 17.
Is it still 10% of calories? Not in the United States. That was the 2020–2025 rule. The 2025–2030 Dietary Guidelines, issued 7 January 2026, dropped the percentage and replaced it with “no amount is recommended” plus no more than 10 g per meal. The only 10%-of-calories limit in the current edition is for saturated fat. The WHO’s below-10% recommendation does still stand.
Does the sugar in fruit count? No. Whole fruit is excluded by every system — American and WHO alike. Fruit juice is the exception: the US label counts no added sugar in 100% juice, but the WHO classes it as a free sugar, and the large cardiovascular cohort that used that definition named fruit juice as one of its three main sources.
Is honey better than white sugar? Not for this purpose. Honey, maple syrup, agave and coconut sugar are added sugars in full, and the 2025–2030 Guidelines name honey and molasses explicitly. The trace minerals do not change the count.
Drinks or food — which matters more? Drinks, on both counts. They are about 24% of all added sugar intake, and the clearest harm evidence attaches to liquid sugar. A 12 oz can of cola carries roughly 39–42 g — about ten teaspoons, more than a man’s whole daily limit, and four meals’ worth under the new cap.
Where is the sugar I am not tasting? Bread, ketchup, salad dressing, barbecue and teriyaki sauces and jarred pasta sauce. A savoury lunch with no sweet item in it commonly reaches 9 to 16 g — at or over a whole meal’s cap.
Is a granola bar better than a cookie? Frequently not. Both tend to land around 8–12 g, and most bars fail the FDA’s 5 g ceiling for a “healthy” grain snack.
What about children? The guidance tightened considerably. The current American edition says to avoid added sugars from birth through age 4, that no amount is recommended from 5 to 10, and that adolescents should significantly limit sugary and energy drinks.
Are artificial sweeteners the answer? The 2025–2030 Guidelines say no amount of non-nutritive sweeteners is recommended either, naming aspartame, sucralose, saccharin, xylitol and acesulfame K. That is a position, not a finding of harm — but swapping sweetened drinks for sweetened-with-something-else drinks is not what the guidance asks for.
When should I see a doctor? If you have prediabetes or diabetes, raised triglycerides, fatty liver disease or metabolic syndrome, added sugar is part of a clinical picture and the targets are your clinician’s to set. Also worth raising: eating patterns that feel compulsive rather than chosen — that is a different problem from a dietary one, and it responds to different help.
The Bottom Line: Tomorrow’s Breakfast
The new rule is per meal, so the useful place to end is at one meal — the next one you will eat.
Tomorrow morning, change two things and nothing else.
Swap the flavoured yogurt or sweetened cereal for plain yogurt or plain oats, and add fruit yourself. That is 15 to 20 grams out of the day, it tastes sweet, it takes no extra time, and you only have to decide it once in the shop. Of everything on this page, this is the substitution with the best ratio of effect to effort.
And make the morning drink water, coffee or plain tea. If a flavoured latte or a can is part of your morning, this is worth more than the yogurt — 25 to 50 grams, two to five meals’ worth, from a single container that leaves you no fuller.
Do those two and breakfast comes in under ten grams without anybody counting anything. When that is automatic, look at lunch: the bread, the ketchup and the dressing are the same kind of one-off purchase decision, and together they are another nine to sixteen grams you were never tasting.
What not to do tomorrow: do not try to reach zero, do not read every label in the shop, and do not start with dessert. Dessert you chose and tasted. The sugar worth your attention is the sugar that arrived without being chosen — and it is concentrated in the morning and in whatever you drink.
This article is general information, not medical advice. If you are managing diabetes, prediabetes, fatty liver disease, raised triglycerides or metabolic syndrome, your added-sugar targets are part of a treatment plan and belong to the clinician managing it. The evidence behind population sugar limits is weaker than the confidence with which it is usually stated — this page says so explicitly above — and nothing here should be read as a claim that added sugar is the single cause of any disease.
References
- Dietary Guidelines for Americans, 2025–2030 — the primary document: “no amount of added sugars… is recommended,” the 10 g per-meal limit, the age guidance, the snack ceilings and the sugar-sweetened beverage advice
- American Dental Association News — HHS and USDA release the 2025–2030 Dietary Guidelines (7 January 2026)
- Harvard T.H. Chan School of Public Health, The Nutrition Source — Dietary Guidelines for Americans 2025–2030: what changed on added sugar, and the criticisms of the process
- WHO — WHO calls on countries to reduce sugars intake among adults and children (2015): the strong below-10% and conditional below-5% recommendations, the free-sugars definition, and the caries and weight evidence behind them
- American Heart Association — How Much Sugar Is Too Much? The 25 g / 36 g limits, the 24% share from sugary drinks, and the ten teaspoons in a can of soda
- CDC — Added Sugars: measured intake of 17 teaspoons a day for US adults (men 19, women 15) from NHANES 2017–2018, and the leading food sources
- Kelly RK, et al. Associations between types and sources of dietary carbohydrates and cardiovascular disease risk. BMC Medicine, 2023 — 110,497 participants, 9.4 years, and the per-5%-of-energy risk figures (Oxford Population Health summary)
- Schwimmer JB, et al. Effect of a Low Free Sugar Diet vs Usual Diet on Nonalcoholic Fatty Liver Disease in Adolescent Boys. JAMA, 2019 — the randomised trial, its 6.23% steatosis difference and the ALT result (Healio summary)
- Erickson J, Sadeghirad B, Lytvyn L, Slavin J, Johnston BC. The Scientific Basis of Guideline Recommendations on Sugar Intake: A Systematic Review. Annals of Internal Medicine, 2017;166(4) — the “not trustworthy” conclusion, the GRADE ratings, and the ILSI North America funding disclosure
- Guidelines to Limit Added Sugar Intake: Junk Science or Junk Food? — the accompanying Annals of Internal Medicine editorial disputing that review
- Corporations and Health Watch — commentary on the Annals review, the editorial response, and the industry-funding question
- FDA — Use of the “Healthy” Claim on Food Labeling: the ≤2.5 g dairy and ≤5 g grain added-sugar ceilings per reference amount, final rule December 2024, compliance February 2028
- FDA — Daily Value on the Nutrition and Supplement Facts Labels: the 50 g added sugars Daily Value
- Harvard Health — The Sweet Danger of Sugar